Trading platform
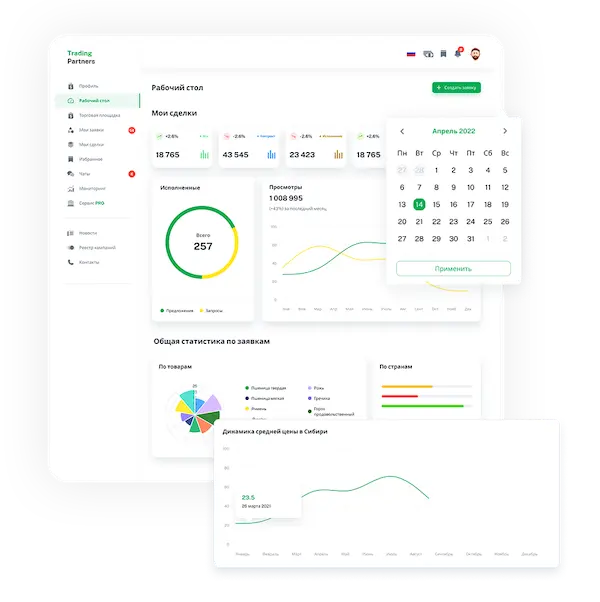
 Monitoring
  Express applications
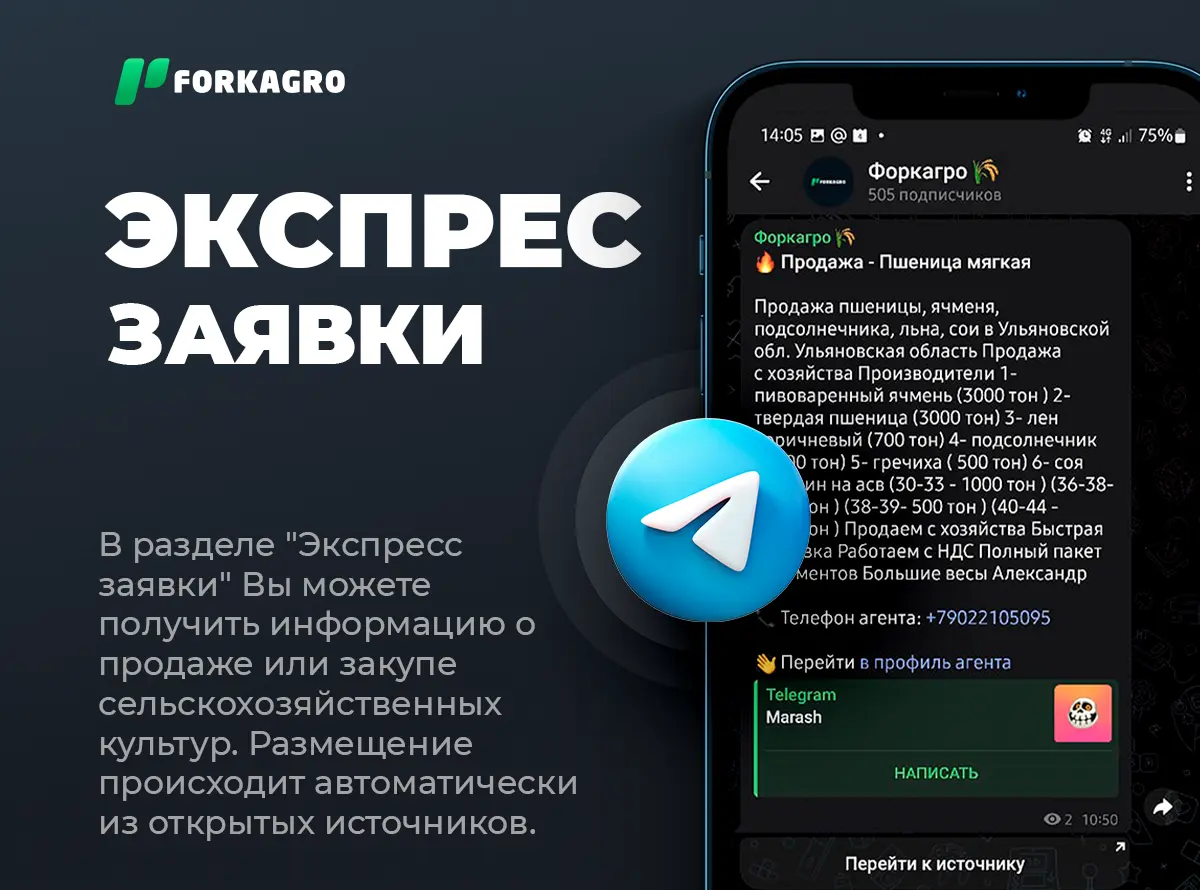
 Fork Work
 Service
  News
News  Directory
 Trading platform


Sugar, 01.01.2025-05.04.2025


Analysis of price monitoring data for sugar
2025 © FORKAGRO
General dynamics of average price sugar from 01.01.2025 - 05.04.2025
Dynamics of the average price sugar from 01.01.2025 - 05.04.2025
Far Eastern Federal District
Siberian Federal District
Ural federal district
Volga Federal District
Central Federal District
Northwestern Federal District
Southern Federal District
Monitoring reflects the dynamics of purchase prices of processing and grain trading organizations. The schedule is based on the prices of RUB/t without VAT. The data is updated weekly and is the basis for calculating the commodity index (Producer Price Index, PPI). The index is an indicator of the current average price level and is calculated as the weighted average price of the regions.
Dynamics by city
| City | Price RUB/t |
|---|---|
| Angarsk |
71666.67 RUB
757.55 EUR
842.98 USD
6213.73 CNY
|
| Barnaul |
67233.33 RUB
710.68 EUR
790.83 USD
5829.34 CNY
|
| Bogdanovich |
64500.00 RUB
681.79 EUR
758.68 USD
5592.36 CNY
|
| Chelyabinsk |
64297.78 RUB
679.65 EUR
756.30 USD
5574.82 CNY
|
| Ekaterinburg |
64461.36 RUB
681.38 EUR
758.23 USD
5589.01 CNY
|
| Irkutsk |
71575.00 RUB
756.58 EUR
841.90 USD
6205.78 CNY
|
| Izhevsk |
63900.00 RUB
675.45 EUR
751.62 USD
5540.33 CNY
|
| Kazan |
63300.00 RUB
669.11 EUR
744.57 USD
5488.31 CNY
|
| Kemerovo |
67576.92 RUB
714.32 EUR
794.87 USD
5859.14 CNY
|
| Khabarovsk |
75305.56 RUB
796.01 EUR
885.78 USD
6529.23 CNY
|
| Krasnodar |
59600.00 RUB
630.00 EUR
701.05 USD
5167.51 CNY
|
| Krasnoyarsk |
67327.78 RUB
711.68 EUR
791.94 USD
5837.53 CNY
|
| Lipetsk |
59300.00 RUB
626.83 EUR
697.52 USD
5141.50 CNY
|
| Moscow |
62920.59 RUB
665.10 EUR
740.10 USD
5455.42 CNY
|
| Nizhny Novgorod |
63416.67 RUB
670.34 EUR
745.94 USD
5498.43 CNY
|
| Novokuznetsk |
68375.00 RUB
722.75 EUR
804.26 USD
5928.33 CNY
|
| Novosibirsk |
67389.83 RUB
712.34 EUR
792.67 USD
5842.91 CNY
|
| Omsk |
66906.25 RUB
707.23 EUR
786.99 USD
5800.99 CNY
|
| Penza |
62250.00 RUB
658.01 EUR
732.22 USD
5397.27 CNY
|
| Saint Petersburg |
63500.00 RUB
671.22 EUR
746.92 USD
5505.65 CNY
|
| Samara |
61650.00 RUB
651.67 EUR
725.16 USD
5345.25 CNY
|
| Vladimir |
65750.00 RUB
695.01 EUR
773.38 USD
5700.74 CNY
|
| Yoshkar-Ola |
63558.33 RUB
671.84 EUR
747.61 USD
5510.71 CNY
|
100
Chart connection code
<script type="text/javascript" src="https://forkagro.com/en/panel/chart/graph-widget?productId=32&dateFrom=01.01.2025&dateTo=05.04.2025"></script>
<div id='widgetGraphContainer'></div>
<div id='widgetGraphContainer'></div>
Graph widget on your website
Sugar - wholesale purchase prices per week
Monitoring reflects the dynamics of purchase prices of processing and grain trading organizations. The schedule is based on the prices of RUB/t without VAT. The data is updated weekly and is the basis for calculating the commodity index (Producer Price Index, PPI).
Prices are collected from the websites of companies once a week, until 09:00 (Moscow time) and until 20:00 (Moscow time) and are for informational purposes only. Forkagro.com is not responsible for the discrepancy between the prices presented and the current sales prices.